You seat the card and load the model. nvidia-smi reads GPU-Util 80%. It looks busy. You close the window.
Put the datasheet TFLOP/s next to the tokens that actually come out and the numbers disagree. A 312 TFLOP/s card delivers tokens at a few hundredths of that peak. The question is what the 80% was 80% of.
GPU-Util on the monitor is not how densely the chip computed. It is the fraction of a short window in which at least one kernel was running. The invoice is tokens. You pay for time and get paid for tokens.
It is a truck on a loan. The payment leaves every month. The engine still turns with an empty bed. The 80% on the gauge can be that idle, sold as highway.
The numbers are not a bench. They are an equation. Units are SI. 1 MB = 10^6 B, 1 GB = 10^9 B.
1. Decode is a read, not a multiply
A large language model appends one token at a time. That step is decode. What the GPU mostly does then is not multiplying matrices without rest. It is fetching weights already bought, out of memory.
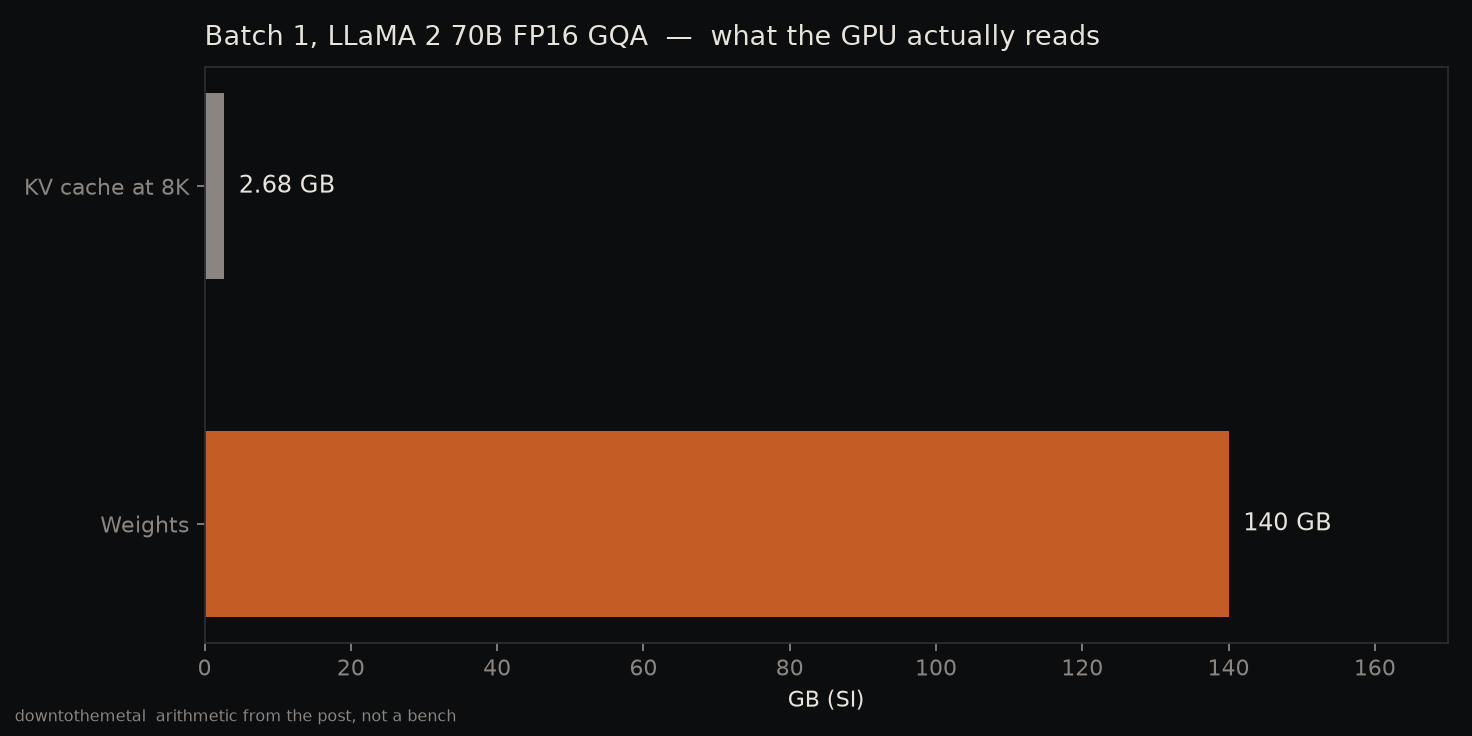
A 70B model in FP16 is 70e9 × 2 B = 140 GB of weights. About 2 FLOP per parameter per token is 70e9 × 2 = 1.4e11 FLOP, against 140 GB = 1.4e11 B read. Divide and you get 1 FLOP/B.
Whether that is large depends on how many FLOP the card can sustain per byte from memory. On an A100 80GB SXM, Tensor peak 312 TFLOP/s over 2039 GB/s is a knee of 153 FLOP/B. Decode at 1 FLOP/B is 1/150 of that knee. The 40GB SKU is listed at about 1.6 TB/s, so the knee moves to about 195. The ratio is similar. Util can sit at 100% while Tensor cores mostly wait. Time the chip was not idle is not time the arithmetic was full.
2. The lever is batch
The engine (Util) runs whether you haul one ton or twenty. Revenue grows when you load the bed.
Decode is the same. Read the 140 GB once and stack several questions on that read. That count is batch. Sequences split the fetch.
The bed is not infinite. Each sequence leaves a memory of tokens so far on the GPU. That memory is the KV cache. Trailer size = leftover HBM ÷ KV per token.
3. Trailer size, eightfold
KV is the table the model keeps so it does not multiply the past again. The table lengthens with tokens. Without a cache, every new token re-multiplies history, and work grows as length squared. With a cache you compute the new token and read the past.
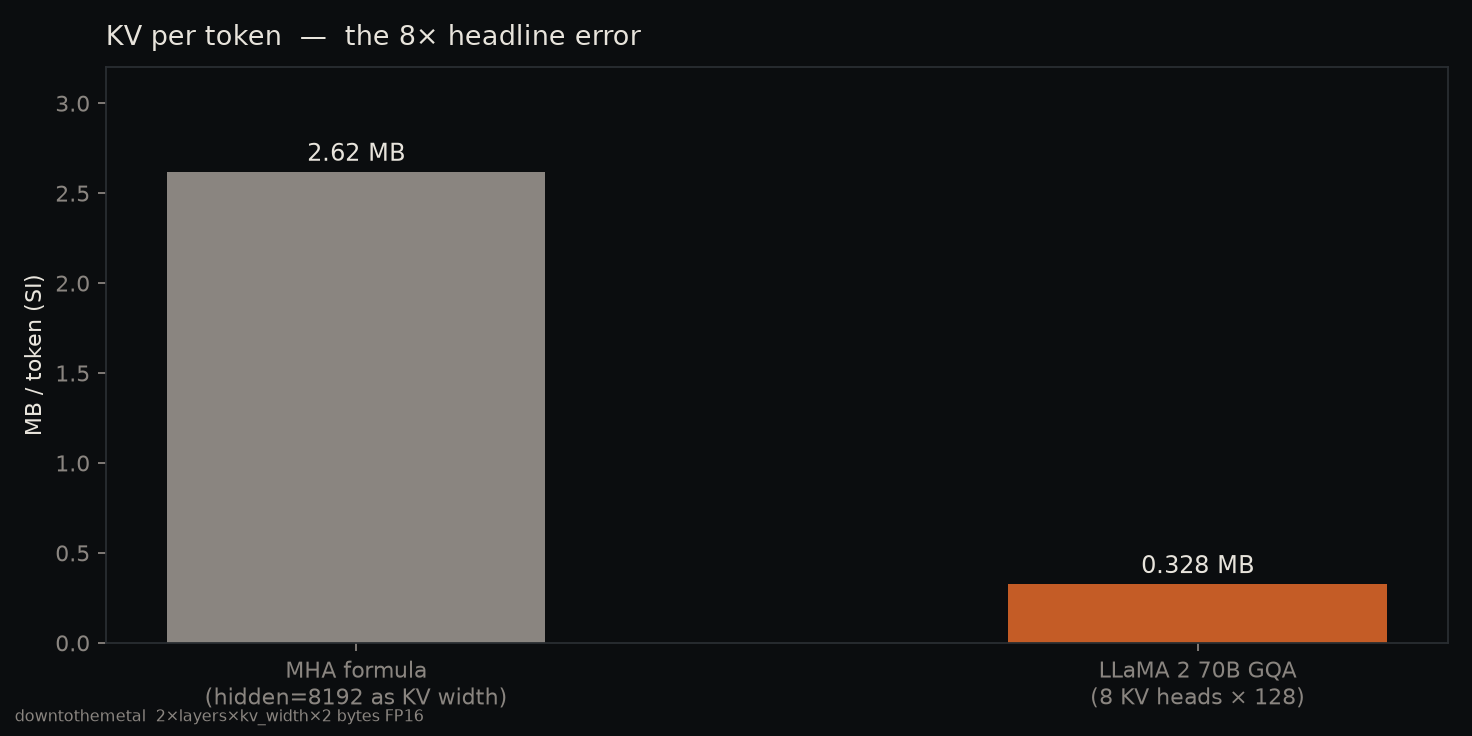
A formula that circulates online: 80 layers, width 8192, FP16 → 2 × 80 × 8192 × 2 B = 2.62 MB per token. At 8K that is 21.5 GB. That formula is multi-head attention: as many KV heads as query heads. It is close to LLaMA 1 65B.
LLaMA 2 70B is GQA (grouped-query attention). Eight KV heads, width 1024. The same formula is 0.328 MB per token. At 8K, 2.68 GB. About eight times less. “70B is 2.6 MB per token” is the first formula glued onto the later model.
At the same 8K, 21.5 GB and 2.68 GB leave different room for batch. Util 80% does not report that gap.
4. What is left to decide
“Util 80% means we are computing.” That is the gauge. “Just raise the context.” That is not measuring the trailer.
Buy another card, shorten context, pick a GQA model, quantize KV — those are variables in one equation. A utilization percentage is not the answer.
Notes
- Knee 153 FLOP/B: 312e12 / 2039e9, read as 80 GB SXM. At 40 GB (~1.6 TB/s) the knee is about 195. The 1-to-150 point stands.
- vLLM “24×” is versus Hugging Face; “23×” is versus static batching. Different benches. Exponential output length and ignored EOS are conditions of those benches. Not our measurement.